
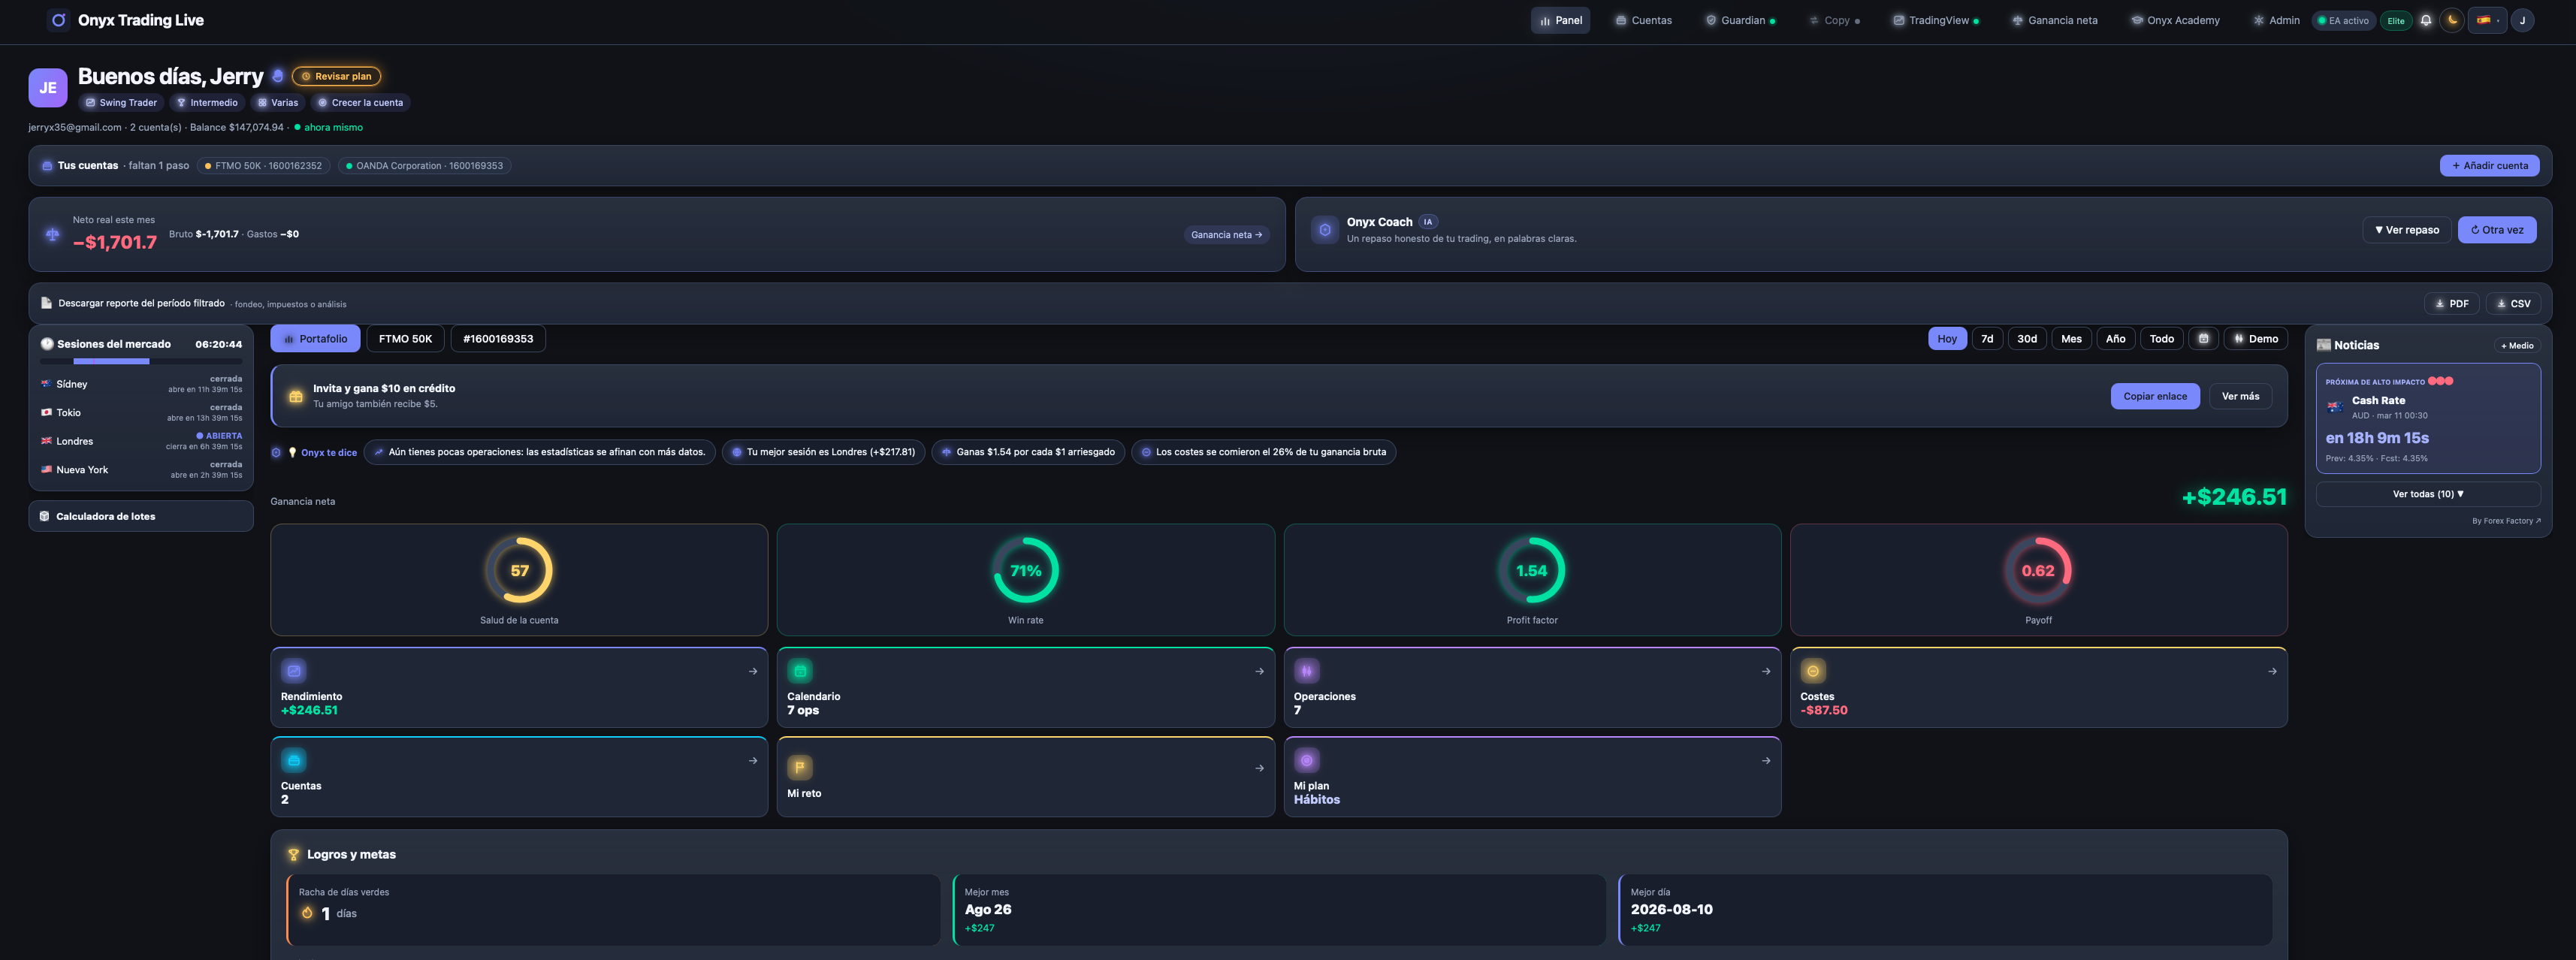
The power of seeing your trading in real time
Every order you open, every close, every winning or losing streak: it all happens faster than the human eye can follow. That's why a clear dashboard isn't just nice to have—it's a tool for psychological survival in trading. Onyx's dashboard pools your trading statistics into one view, without clutter, so you always know exactly where you stand.
What you see in the Onyx dashboard
Once you connect your accounts (MetaTrader, cTrader, or MatchTrader soon), the dashboard fills automatically with live data:
- Account summary: balance, equity, available margin, and margin usage percentage. Numbers that move with every market tick.
- Active trades: all open positions with real-time P&L, no need to maximize windows in your platform.
- Today's history: last closed trades with entry, exit, result, and duration. Perfect for reviewing recent decisions without noise.
- Cumulative stats: winners vs. losers, win rate, average loss, risk-to-reward ratio, and current streak. Here's where you spot patterns.
- Active protections: Guardian (your risk manager) shows daily loss limits, total loss limit, and whether you're protected ahead of high-impact news.
- My Challenge: if you're trading a funded or prop firm account, this tracker compares your progress against your challenge rules: profit target, max daily/total loss, days completed, consistency. A direct mirror between your performance and the criteria you need to meet.
Why this matters in practice
A trader without clear data is like a pilot without instruments. Onyx's dashboard separates what's critical from what's noise:
1. Live decisions: when you see you've already hit 40% of your daily loss limit, you can raise your entry standard on new trades or simply stop. No surprises at close. 2. Discipline through transparency: Guardian alerts you before something happens. High-impact news coming, limits about to be touched: everything in one notification. 3. Analysis without emotion: the numbers on your dashboard don't judge; they just show. Low win rate → tweak your entry criteria. Long losing streak → check your mental state. Data guides you, it doesn't accuse. 4. Multi-account management made simple: if you run copy trading across accounts (Elite and Black Onyx plans), the dashboard lets you see all of them at once. Master and slave accounts at a glance.
Access from anywhere
Onyx is cross-platform, and so is the dashboard. Log in from your desktop browser, tablet, or mobile (Onyx is installable as a PWA on iPhone and Android from your browser); data syncs instantly. Whether you're at your desk or checking your account on a break: you always see the same thing.
Smart alerts that protect you
Beyond the visual dashboard, Elite plans and above include Telegram alerts: when your funded account is at risk, when you hit a milestone, if your EA fails, or an automatic daily summary. The dashboard is your control panel; alerts are your safety net.
What the dashboard does NOT do
Let's be clear: Onyx's dashboard does not predict the market or give buy/sell signals. It won't tell you when to enter; it tells you how you're doing after you enter. If you use TradingView alerts to open trades automatically (paid plans), Onyx executes those alerts and Guardian supervises them. Trading decisions are yours; transparency and risk control are ours.
Close the loop: data that empowers
The best investment a trader makes isn't money: it's insight into themselves. Onyx's dashboard gives you that. You see your streak, your consistency, your rule adherence. And that changes you. Not because the numbers promise profits, but because they teach you to respect the process.
If you haven't connected your accounts yet, the Free plan lets you start at no cost: one active account, access to the dashboard, and basic Guardian. From there, you grow at your pace.
%22%2F%3E%3Ctext%20x%3D%2248%22%20y%3D%2272%22%20font-family%3D%22Arial%2CHelvetica%2Csans-serif%22%20font-size%3D%2217%22%20font-weight%3D%22800%22%20letter-spacing%3D%224%22%20fill%3D%22%23b9c0ff%22%3EPROP%20FIRMS%3C%2Ftext%3E%3Ctext%20x%3D%2248%22%20y%3D%22176%22%20font-family%3D%22Arial%2CHelvetica%2Csans-serif%22%20font-size%3D%2234%22%20font-weight%3D%22800%22%20fill%3D%22%23f2f4ff%22%3EProfit%20Reinvestment%3A%3C%2Ftext%3E%3Ctext%20x%3D%2248%22%20y%3D%22218%22%20font-family%3D%22Arial%2CHelvetica%2Csans-serif%22%20font-size%3D%2234%22%20font-weight%3D%22800%22%20fill%3D%22%23f2f4ff%22%3ECompound%20Effect%20in%20Funded%3C%2Ftext%3E%3Ctext%20x%3D%2248%22%20y%3D%22260%22%20font-family%3D%22Arial%2CHelvetica%2Csans-serif%22%20font-size%3D%2234%22%20font-weight%3D%22800%22%20fill%3D%22%23f2f4ff%22%3ETrading%20Accounts%3C%2Ftext%3E%3Ctext%20x%3D%2248%22%20y%3D%22356%22%20font-family%3D%22Arial%2CHelvetica%2Csans-serif%22%20font-size%3D%2218%22%20font-weight%3D%22700%22%20fill%3D%22%23cfd4ff%22%3EOnyx%20Trading%20Live%3C%2Ftext%3E%3C%2Fsvg%3E)
%22%2F%3E%3Ctext%20x%3D%2248%22%20y%3D%2272%22%20font-family%3D%22Arial%2CHelvetica%2Csans-serif%22%20font-size%3D%2217%22%20font-weight%3D%22800%22%20letter-spacing%3D%224%22%20fill%3D%22%23b9c0ff%22%3EBITCOIN%3C%2Ftext%3E%3Ctext%20x%3D%2248%22%20y%3D%22176%22%20font-family%3D%22Arial%2CHelvetica%2Csans-serif%22%20font-size%3D%2234%22%20font-weight%3D%22800%22%20fill%3D%22%23f2f4ff%22%3EBitcoin%20Rallies%20to%20%2485%2C500%3C%2Ftext%3E%3Ctext%20x%3D%2248%22%20y%3D%22218%22%20font-family%3D%22Arial%2CHelvetica%2Csans-serif%22%20font-size%3D%2234%22%20font-weight%3D%22800%22%20fill%3D%22%23f2f4ff%22%3Eon%20Soft%20PCE%20but%20Fades%20as%3C%2Ftext%3E%3Ctext%20x%3D%2248%22%20y%3D%22260%22%20font-family%3D%22Arial%2CHelvetica%2Csans-serif%22%20font-size%3D%2234%22%20font-weight%3D%22800%22%20fill%3D%22%23f2f4ff%22%3EBond%20Yields%20Stay%20Elevated%3C%2Ftext%3E%3Ctext%20x%3D%2248%22%20y%3D%22356%22%20font-family%3D%22Arial%2CHelvetica%2Csans-serif%22%20font-size%3D%2218%22%20font-weight%3D%22700%22%20fill%3D%22%23cfd4ff%22%3EOnyx%20Trading%20Live%3C%2Ftext%3E%3C%2Fsvg%3E)
%22%2F%3E%3Ctext%20x%3D%2248%22%20y%3D%2272%22%20font-family%3D%22Arial%2CHelvetica%2Csans-serif%22%20font-size%3D%2217%22%20font-weight%3D%22800%22%20letter-spacing%3D%224%22%20fill%3D%22%23b9c0ff%22%3EBCE%3C%2Ftext%3E%3Ctext%20x%3D%2248%22%20y%3D%22197%22%20font-family%3D%22Arial%2CHelvetica%2Csans-serif%22%20font-size%3D%2234%22%20font-weight%3D%22800%22%20fill%3D%22%23f2f4ff%22%3ELagarde%20in%20La%20Croix%3A%20ECB%3C%2Ftext%3E%3Ctext%20x%3D%2248%22%20y%3D%22239%22%20font-family%3D%22Arial%2CHelvetica%2Csans-serif%22%20font-size%3D%2234%22%20font-weight%3D%22800%22%20fill%3D%22%23f2f4ff%22%3EPerspectives%3C%2Ftext%3E%3Ctext%20x%3D%2248%22%20y%3D%22356%22%20font-family%3D%22Arial%2CHelvetica%2Csans-serif%22%20font-size%3D%2218%22%20font-weight%3D%22700%22%20fill%3D%22%23cfd4ff%22%3EOnyx%20Trading%20Live%3C%2Ftext%3E%3C%2Fsvg%3E)